Songbirds have an extra chromosome in their germline

A recent study tried to figure out what this chromosome actually does…

Yesterday, you could read about the crazy sex-chromosomes of larks. It turned out that the sex-chromosomes of these birds consists of parts from several other chromosomes. Weird… A recent study in the journal Nature Communications revealed another chromosomal conundrum in songbirds: the so-called germline restricted chromosome (or GRC for friends). Let’s get acquainted.

Taeniopygia_guttata

What mysteries does the GRC of this Zebra Finch (Taeniopygia guttata) hold? © Peripitus | Wikimedia Commons


An Accessory Chromosome

The story of the GRC starts with two researchers investigating the karyotype of the Zebra Finch (Taeniopygia guttata). In the germline (i.e. cells in the testes and ovaries) of this bird, they found a big “accessory” chromosome. Surprisingly, in the rest of the body cells – the so-called soma – this chromosome was absent. Further investigations revealed that, in males, it is eliminated during the formation of sperm cells. In females, however, the chromosome is passed on to the offspring but gets eliminated in soma-cells. Good riddance, chromosome! Because this extra chromosome only resides in the germline, it was dubbed germline-restricted chromosome (GRC).

GRC_karyotype

The karyotypes seven biggest chromosomes and sex chromosomes (ZW) of Zebra Finch for (a) female soma, (b) male some, and (c) male germline. The big germline-restricted chromosome (GRC) is highlighted with the arrow. From: Pigozzi & Solari (1998) Chromosome Research


Which Genes?

The presence of the GRC raises a lot of questions. First of all, what kind of genes are on this chromosome? The researchers of the recent study predicted that the GRC would be enriched in repetitive elements, a kind of wastebasket for harmful “genetic parasites”. Surprisingly, the GRC contained numerous genes from other chromosomes (i.e. paralogs). Using a clever combination of the latest genome-sequencing techniques and some bioinformatic wizardry, they succeeded in pinpointing 115 high-confidence GRC-linked genes. These genes were copied to the GRC from 19 chromosomes (18 autosomes and the Z-chromosome).

GRC_chromosomes.jpg

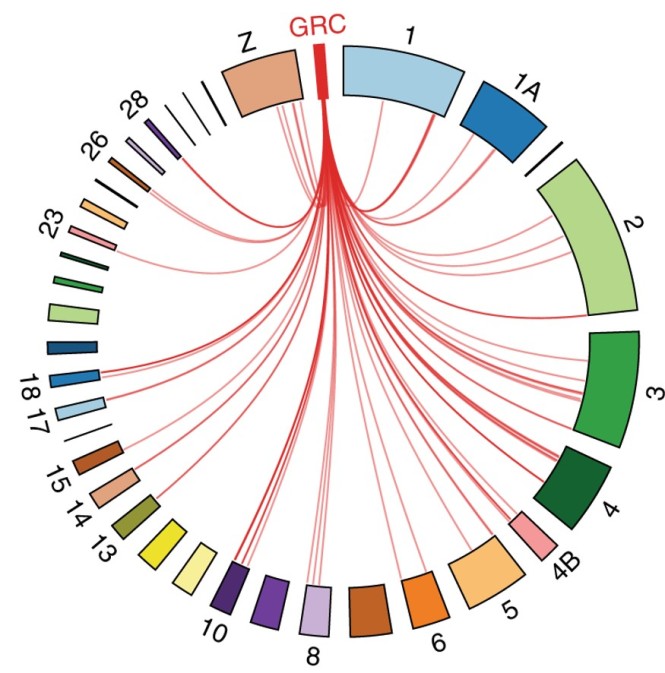
The GRC contains gene from numerous other chromosomes. From: Kinsella, Ruiz-Ruano et al. (2019) Nature Communications


Expressed Genes?

The presence of these genes does not necessarily mean that they are actively used. Perhaps the GRC is a reservoir for decaying pseudogenes? To infer whether these genes are active, the researchers turned to transcriptomic (RNA) and proteomic (proteins) data. These analyses revealed that at least 6 genes were expressed in testes and 32 in ovaries. Because some GRC-genes are (almost) identical to their paralogs on other chromosomes, the researchers could not distinguish between them. Thus, there might be more active GRC-genes.

The divergence between some GRC-genes and their paralogs already indicates that different genes were copied to the GRC at different times. By comparing the DNA-sequence of GRC-genes and paralogs, we can deduce how the GRC changed over time. Some genes, such as bicc1 and trim71, were early additions during the diversification of songsbirds (more than 25 million years ago). Other genes were recently added to the mix. The figure below gives a nice overview of the gradual accumulation of genes on the GRC.

GRC_tree.jpg

The GRC captured different genes during its evolutionary history. From: Kinsella, Ruiz-Ruano et al. (2019) Nature Communications


What does it do?

The GRC is not restricted to the Zebra Finch. A recent study in PNAS found this chromosome in 15 other songbirds, suggesting that it plays an important role in the germline of these species. The presence of several germline developmental genes indicates that it might act as a germline-determining chromosome. The authors also speculate that “a GRC may allow adaptation to germline-specific functions free of detrimental effects on soma.” In other words, the GRC could prevent conflicts between germline and soma.

Finally, the observation of several species-specific genes on the GRC supports the idea that it might contribute to reproductive isolation during the formation of new species. Could the GRC explain the massive diversification of songbirds?


References

Kinsella, C.M., Ruiz-Ruano, F.J., et al. (2019) Programmed DNA elimination of germline development genes in songbirds. Nature Communications, 10:5468.

Pigozzi, M. I., & Solari, A. J. (1998). Germ cell restriction and regular transmission of an accessory chromosome that mimics a sex body in the zebra finch, Taeniopygia guttataChromosome Research, 6(2):105-113.

Torgasheva, A. A. et al. (2019). Germline-restricted chromosome (GRC) is widespread among songbirds. Proceedings of the National Academy of Sciences116(24), 11845-11850.

The crazy sex-chromosomes of the Larks

The largest sex-chromosome found in birds consists of parts from several other chromosomes.

Let’s talk about sex. To be more specific, let’s talk about sex chromosomes. Most people are familiar with the human system of sex-determination: if you have two X-chromosomes, you are female; and if you have an X and a Y-chromosome, you are male. In birds, the situation is slightly different. Males have two Z-chromosomes, whereas females have a Z and a W chromosome. However, a recent study on larks in the Proceedings of the Royal Society B shows that things are not always that straightforward.

Horned_lark

What happened with the sex-chromosomes of this Horned Lark (Eremophila alpestris)? © Tom Koerner | Wikimedia Commons


Evolution of sex-chromosomes

The sex-determining locus

Before we delve into the findings of that study, we first need to understand the evolution of sex-chromosomes. Who are they? Where do they come from? What drives them? It mostly starts with one genetic locus: the sex-determining locus. Most mammals carry the gene SRY (sex-determining region Y) on the Y-chromosome which is responsible for the start of male sex-determination. In birds, the gene DMRT1 (Doublesex and mab-3 related transcription factor 1) seems to be an important player. Sex chromosomes initially arise when a standard chromosome (i.e. an autosome) acquires a sex-determining gene.


Suppression of recombination

Next, recombination is suppressed around this gene. Recombination occurs during meiosis when homologous chromosomes line up and exchange sections of themselves. This genetic exchange results in new combinations of genetic variants that evolution can work with. The suppression of recombination between a pair of chromosomes allows them the become different from each other. This explains why the X and Y chromosome look so distinct.

Why did recombination become suppressed? The main hypothesis calls upon sexually antagonistic alleles: genetic variants that are under different selection pressures in males and females. For example, a particular variant might be beneficial in males but detrimental in females. By residing close to the sex-determining locus, these genes end up on different chromosomes and eventually spend most of their time in the sex they benefit.

As more and more sexually antagonistic alleles accumulate around the sex-determining locus, larger sections of the chromosome stop recombining. This recurring process gives rise to “evolutionary strata” on the sex-chromosome that started diverging at different time points.


Degeneration of sex chromosomes

Finally, the sex chromosomes stop recombining altogether, mostly leading to rapid degeneration of one chromosome. In humans, this happened to the Y-chromosome, while in birds, the W-chromosome is degenerating. Eventually, these chromosomes can disappear completely. The figure below gives a nice overview of the evolution of sex chromosomes that I just described.

sex_chromosome_evolution

The evolution of sex chromosomes: from a sex-determining locus to the degeneration (and potential loss) of one sex-chromosome. From: Vicoso (2019) Nature Ecology & Evolution


Sex-specific Signatures

Back to the larks! Previous studies already indicated that something fishy is going on with the sex-chromosomes of these birds. A cytogenetic study of Bimaculated Lark (Melanocorypha bimaculata) and Horned Lark (Eremophila alpestris) revealed extremely large sex-chromosomes. And a genetic study of the Razo Lark (Alauda razae) indicated sex-specific inheritance of markers on chromosomes 3 and 5. This prompted Hanna Sigeman and her colleagues to have a closer look at these species.

Genomic analyses of four species – Bimaculated Lark, Raso Lark, Eurasian Skylark (Alauda arvensis) and Bearded Reedling (Panurus biarmicus) – uncovered some interesting patterns. The researchers found sex-specific signatures on the entire Z-chromosome (what you would expect), but also on chromosomes 3, 4A and 5. The strength of these signatures varied between the species, suggesting that different parts of these chromosomes have been added to the Z-chromosome at different times.

lark_chromosomes

The sex-specific signatures in the genome of three larks and the Bearded Reedling. The red shading indicates decreased sequencing depth in females, and the blue shading points to female-specific genetic variants. From: Sigeman et al. (2019) Proceedings of the Royal Society B


Evolutionary Strata

Using the phylogenetic relationships between the species, the researchers could estimate when different chromosome-sections (or strata) were added to the sex-chromosomes. The first strata is the Z-chromosome itself, which arose about 140 million years ago in an ancestor of birds. The second oldest stratum – coming from chromosome 4A – formed when the suborder Sylvioidea split from all other songbirds, roughly 21-19 million years ago. About 19-17 million years ago, chromosome 3 contributed its first share to the sex-chromosome. A few million years later, between 17 and 14 million years ago (when the Larks and the Bearded Reedling parted ways), chromosome 3 made its second contribution. Finally, chromosome 3 (again!) and 5 were added to the mix between 14 and 6 million years ago. The final result is the largest avian sex-chromosome known to date: 195,300,000 DNA-letters long!

Eurasian_Skylark

The Eurasian Skylark (Alauda arvensis), owner of the largest sex-chromosome in birds. © Imran Shah | Wikimedia Commons


References

Sigeman, H., Ponnikas, S., Chauhan, P., Dierckx, E., Brooke, M. L. & Hansson, B. (2019) Repeated sex chromosome evolution in vertebrates supported by expanded avian sex chromosomes. Proceedings of the Royal Society B.

Vicoso, B. (2019). Molecular and evolutionary dynamics of animal sex-chromosome turnover. Nature Ecology & Evolution, 1-10.


Islands in the Andes: Are populations of the Plumbeous Sierra-finch in Ecuador genetically distinct?

Recent study points to population expansion during the Last Glacial Maximum.

The sponge of the Andes. That is how the Páramo ecosystem is sometimes called. This collection of lakes, peat and grasslands can be found at 3500 meter above sea level and higher. These pockets of vegetation are separated by valleys and glaciers, giving rise to an ecological archipelago of Páramo islands. Birds (and other organisms) living on these “islands” might get isolated and gradually evolve into different species. A recent study in the Journal of Ornithology checked whether this is happening to the Plumbeous Sierra-finch (Geospizopsis unicolor).

Plumbeous_Sierra-finch.jpg

The Plumbeous Sierra-finch (Geospizopsis unicolor) © Allan Drewitt | Flickr


Haplotypes

Elisa Bonaccorso and her colleagues collected samples from 17 locations across the Ecuadorian Andes. Genetic analyses of two mitochondrial markers revealed no genetic differentiation between different Páramo islands. Indeed, the haplotype network shows that different islands (the colors) share the same haplotypes (the circles). If there was genetic differentiation, the circles would have distinct colors.

This pattern can be explained in several ways. Possibly, the finches are not isolated on their respective Páramo islands and they can travel between islands over low ridges (so-called “nudos”). This would result in gene flow between neighboring islands. Alternatively, the birds have been isolated for an insufficient amount of time to develop genetic differentiation.

finch_map_haplo.jpg

(A) Sampling locations in Ecuador and (B) the resulting haplotype network. The sharing of different haplotypes (the circles) by different islands (the colors) show that there is no genetic differentiation between the islands. From: Bonaccorso et al. (2019) Journal of Ornithology


Last Glacial Maximum

The second explanation (isolated for an insufficient amount of time) is supported by other analyses. The researchers used ecological niche modelling to reconstruct the range of the Plumbeous Sierra-finch during the Last Glacial Maximum (21,000 years ago) and the Middle Holocene (6,000 years ago). During these periods, the Páramo extended to lower elevations and connected the now isolated islands. This might have facilitated gene flow between different finch populations. Moreover, the genetic data indicated a population expansion between 14,000 and 28,000 years ago.

These findings support a scenario in which populations from different Páramo islands came into contact during the Last Glacial Maximum. However, the authors caution that more research with genomic data is needed to confirm this hypothesis.


References

Bonaccorso, E., Rodríguez-Saltos, C., Vélez-Márquez, A., & Muñoz, J. (2019). Population genetics of the Plumbeous Sierra-finch (Geospizopsis unicolor) across the Ecuadorian paramos: uncovering the footprints of the last ice age. Journal of Ornithology, 1-9.

Multispecies hybridization among Thrushes (genus Catharus)

Genetic study uncovers gene flow between several Catharus thrushes.

“Hybridization is not always limited to two species; often multiple species are interbreeding.” This is the first sentence of my recent Avian Research review on multispecies hybridization in birds. In that paper, I argue that hybridization between multiple bird species is probably a common phenomenon, but that we do not know how important it is from an evolutionary point of view. However, before we can assess the evolutionary importance of multispecies hybridization, we first need to know which species are hybridizing. A recent study in the journal Molecular Phylogenetics and Evolution provided some insights for thrushes of the genus Catharus.

Catharus_fuscescens_CT

A Veery (Catharus fuscescens) © Cephas | Wikimedia Commons


Twelve Species

The Catharus thrushes are small passerines that have been important in understanding the genomic basis of migration (see here). However, the evolutionary relationships between the 12 species in this genus remain contentious. Therefore, Kathryn Everson and her colleagues used a set of ultraconserved elements (UCEs, you can read more about these molecular markers here) to delve into the speciation history of these birds.

Analyses of over 2000 UCEs resulted in well-resolved species tree in which the position of Swainson’s Thrush (C. ustulatus) was rather surprising. In contrast to previous studies, this species clustered with the Veery (C. fuscescens), the Grey-cheeked Thrush (C. minimus) and the Bicknell’s Thrush (C. bicknelli).

Swainson's_Thrush_0777vv.jpg

A Swainson’s Thrush (Catharus ustulatus) © VJAnderson | Wikimedia Commons


Hybridization

However, a closer look at individual gene trees revealed extensive conflict between several genes. In other words, different genes tell different evolutionary stories. Moreover, the species tree (based on UCEs) did not match the mitochondrial tree. These results suggest that hybridization might have influenced the evolution of these thrushes.

Indeed, testing explicitly for introgressive hybridization (using the D-statistic, see here for more details about this test) showed extensive gene flow between several species. The phylogenetic tree below shows the different hybrid interactions between the thrushes. Clearly, multispecies hybridization.

catharus_tree

Phylogenetic tree of the genus Catharus. The arrows indicate gene flow between different species. Solid arrows show strong support (p<0.05), while dashed arrows show weaker support (p<0.1). From: Everson et al. (2019) Molecular Phylogenetics and Evolution


Mitochondrial Capture

The disagreement between UCEs and mtDNA can be explained by mitochondrial capture. The researchers suspect that an ancient hybridization event between Swainson’s thrush and the ancestor of the Ruddy-capped Nightingale-thrush (C. frantzii) and the Black-billed Nightingale-thrush (C. gracilirostris) might have resulted in the exchange of mtDNA.

Black-billed_Nightingale-thrush.jpg

A Black-billed Nightingale-thrush (Catharus gracilirostris) © Jerry Oldenettel | Flickr


Heteropatric Speciation

The results of this study are not only of interest to the question of multispecies hybridization, they are also relevant for the heteropatric speciation scenario. This model applies to populations that occur in the same area at some times during the year (when they can hybridize), but are geographically separated at other times. Migratory species, such as some of the Catharus thrushes, are an excellent study system to explore this speciation model. And the results from this study do fit the proposed scenario. Indeed, the authors write that “seasonal sympatry could promote hybridization and result in reticulate or networked genetic evolution among congeners.”


References

Everson, K. M., McLaughlin, J. F., Cato, I. A., Evans, M. M., Gastaldi, A. R., Mills, K. K., Shink, K. G., Wilbur, S. M. & Winker, K. (2019). Speciation, gene flow, and seasonal migration in Catharus thrushes (Aves: Turdidae). Molecular Phylogenetics and Evolution139, 106564.

Ottenburghs, J. (2019). Multispecies hybridization in birds. Avian Research10(1), 20.


Thanks to Kevin Winker for sending me this paper, which has been added to the Turdidae page.

Cultural evolution contributes to speciation in Crossbills

Divergence in call types results in reproductive isolation.

New species can arise despite ongoing gene flow. One possible route is ecological speciation where populations become reproductively isolation due to divergent natural selection on particular traits. A textbook example of such a scenario concerns Crossbill (genus Loxia). These birds have diversified in beak morphology because they specialized on eating the seeds from different conifer species. The different beak shapes lead to different call types which are used to form flocks. Because the birds pick their partner within a flock, there is reproductive isolation between the different call types. And it all started with a cone seed…

Red_Crossbills_(Male)

Two Red Crossbills in Oregon (USA) © Elaine R. Wilson | Nature’s Pic’s Online


Crossbills

A recent study in Proceedings of the Royal Society B focused on the Cassia Crossbill (L. sinesciuris) which recently diverged from the Red Crossbill (L. curvirostra). About 5000 years ago, the ancestors of the Cassia Crossbill colonized the South Hills. Because the dominant seed predator – the American Red Squirrel (Tamiasciurus hudsonicus) – was absent, the birds adapted to the lodgepole pine and developed larger bills compared to the Red Crossbills. More recently, a certain type of Red Crossbill – the Ponderosa Pine Crossbill – entered the South Hills. The secondary contact between the Cassia Crossbill  and the Ponderosa Pine Crossbill allowed the researchers to test ecological speciation scenario outlined above. They made two predictions:

  1. The calls of the Cassia Crossbill  and the Ponderosa Pine Crossbill should become more different over time.
  2. The birds should flock according to call type.


Divergence in call type?

To test the first prediction, the researchers analyzed more than 3000 recordings of Cassia Crossbills over a period of 20 years (1998-2018). The results show that the calls of these birds steadily become more and more different from the Ponderosa Pine Crossbill (orange line in figure). Next, they compared the calls of Cassia Crossbills with Lodgepole Pine Crossbills, a population that does not coexist with the Cassia Crossbills. Because these species do not interact, there should be not divergent selection on the call types. And indeed, the difference between calls of Cassia Crossbill and Lodgepole Pine Crossbills remained stable over the study period (purple line in figure).

Crossbill_change

Over time the calls of Cassia Crossbills and Ponderosa Pine Crossbill become more different (orange line) whereas the difference with the Lodgepole Pine Crossbill remains stable (purple line). Adapted from Porter & Benkman (2019) Proceedings of the Royal Society B


Flocking behaviour?

The first prediction is confirmed! What about the second one? Do crossbills flock according to call type? To assess the second prediction, the researchers performed playback experiments: they played recordings of Cassia Crossbills that were similar or dissimilar to Ponderosa Pine Crossbill calls. According to the ecological speciation scenario, more Cassia Crossbills should be attracted to the calls that sounded different from the Ponderosa Pine Crossbill. And this was indeed the case as shown in the barplots below.

Crossbill_flock.jpg

More Cassia Crossbills landed when the researchers played calls that did not resemble Ponderosa Pine Crossbills (left). And more Ponderosa Pine Crossbills landed when the researchers played calls that resemble Ponderosa Pine Crossbills (right). Adapted from Porter & Benkman (2019) Proceedings of the Royal Society B


Speciation

This case nicely exemplifies how cultural evolution can contribute to speciation. The calls are learned from the parents and can thus be considered a cultural trait. The authors conclude that “these increasingly divergent vocalizations are imitated by offspring, leading to call divergence at the population level and reduced heterospecific flocking. […] Because Crossbills flock year-round and choose mates from within flocks, increased reproductive isolation is probably a byproduct of character displacement in call structure.”


References

Porter, C. K., & Benkman, C. W. (2019). Character displacement of a learned behaviour and its implications for ecological speciation. Proceedings of the Royal Society B286(1908), 20190761.

Are crows on islands experiencing a mutational meltdown?

A recent study quantified the amount of deleterious mutations in different crow species.

In theory, deleterious mutations accumulate more easily in small populations. Here is how it works: imagine a bucket of 9 green balls and one red ball (i.e. a deleterious mutation). The chance that you will randomly select the red ball is then 1 in 10. If you would take a bigger bucket with 99 green balls and one red ball. The chance of selecting the red ball drops to 1 in 100. The same principle applies to populations. The chances of passing on a deleterious mutation to the next generation are higher in small populations compared to big ones. Over time, deleterious mutations will more easily spread through small populations. This process – called genetic drift – results in a higher mutational load and consequently a higher extinction risk for small populations.

Surprisingly, few studies have tested this prediction with genome-wide data. A recent paper in the journal Molecular Biology and Evolution focuses on several crow species to see whether smaller populations carry more deleterious mutations.

Corvus_splendens

The House Crow (Corvus splendens) © Vinayaraj | Wikimedia Commons


Estimating the DFE

Before we can assess the accumulation of deleterious mutations, we first need to know which mutations are deleterious. Mutations can be divided into three broad categories: deleterious, neutral and advantageous. In reality, however, there is a continuum which ranges from strongly deleterious mutations to highly advantageous ones. The relative frequencies of these mutations form the distribution of fitness effects (DFE).

The DFE can be constructed using mutation experiments. First, you mutate one site in the genome (e.g., turn an A into a C). Then you compare the fitness of an individual with this mutation to the fitness of an individual with the original DNA sequence. And you do this for several locations in the genome. This approach has been performed on the vesicular stomatis virus and showed that most mutations are deleterious (see graph below). Understandably, this method is not feasible for crows.

DFE_in_VSV

The distribution of fitness effects (DFE) for the vesicular stomatis virus. Most mutations are deleterious (smaller than 1). However, there are some advantegeous ones (bigger than 1). © Fiona126 | Wikimedia Commons


Selection and Effective Population Size

Luckily, there are several methods to estimate the DFE from DNA sequence data. These methods rely on two parameters, namely the strength of selection (s) and the effective population size (N). First, the strength of selection determines how easily a mutation can spread through a population. The more deleterious a mutation, the less likely it will conquer a population. Second, the efficiency of selection depends on the effective population size. As I explained above, small populations are vulnerable to the random fluctuations of genetic drift. The larger the population, the less genetic drift plays a role and the more efficient selection becomes.

By combining these two features – selection (s) and the effective population size (N) – we can create several mutation-categories. When the product Ns is bigger than 10, we consider the mutation strongly deleterious. When Ns is between 1 and 10, the mutation is deleterious. And when Ns is equal to 1 or smaller, the mutation is slightly deleterious (or effectively neutral). Applying this approach to human data revealed that about 43% of mutations are strongly deleterious and will be unlikely to spread through the population.

DFE_Humans

Distribution of fitness effects for human data (based on 230 genes). Adapted from Eyre-Walker & Keightley (2007) Nature Reviews Genetics


Crows

With this thorough understanding of the DFE we can finally turn to the crows. Verena Kutschera and her colleagues estimated the DFE for seven crow species. Five species can be found on the mainland, namely the American crow (C. brachyrhynchos), the Carrion Crow (C. corone), the Daurian Jackdaw (C. dauuricus), the Eurasian Jackdaw (C. monedula) and the House Crow (C. splendens). The other two species reside on islands: the New Caledonian Crow (C. moneduloides) is native to – you guessed it – New Caledonia and the White-billed Crow (C. woodfordi) lives on the Solomon Islands.

Analyses of the DFEs from these seven species revealed that island species harbor more deleterious mutations compared to mainland species. Moreover, there was a significant relationship between the amount of deleterious mutations and the geographic range of the species. The smaller the geographic range, the more deleterious mutations. The authors conclude that “species living on islands accumulate mildly deleterious mutations more readily than more widely distributed species.”

crows_graphs

Islands populations have more deleterious mutations compared to mainland populations (left). And there is a significant correlation between the number of deleterious mutations and geographic range (right). Adapted from Kutschera et al. (2019) Molecular Biology and Evolution


Mutational Meltdown?

Does this mean that crows on islands are experiencing a mutational meltdown (as I wrote in the click-bait title above)? Not necessarily. They are certainly more vulnerable to mutational meltdown and consequent extinction, but there might be an unexpected byproduct of this rapid accumulation of mutations. An experiment with the bacteriophage φX174 showed that small populations contained 15% advantageous mutations whereas large populations had none. Moreover, small populations might be able hold on to slightly deleterious or neutral mutations that turn advantageous when the environment changes. However, it is dangerous to extrapolate experimental results from bacteriophages to wild bird populations. Instead, we can monitor the genetic health of these island populations and try to protect them.

American_Crows

A couple of American Crows in Victoria, British Columbia, Canada. © Michal Klajban | Wikimedia Commons


References

Eyre-Walker, A., Woolfit, M., & Phelps, T. (2006). The distribution of fitness effects of new deleterious amino acid mutations in humans. Genetics173(2), 891-900.

Eyre-Walker, A., & Keightley, P. D. (2007). The distribution of fitness effects of new mutations. Nature Reviews Genetics8(8), 610.

Kutschera, V. E., Poelstra, J. W., Botero-Castro, F., Dussex, N., Gemmell, N., Hunt, G. R., Ritchie, M. G., Rutz, C., Wiberg, R. A. W. & Wolf, J. B. (2019). Purifying Selection in Corvids Is Less Efficient on Islands. Molecular biology and evolution.

Sanjuán, R., Moya, A., & Elena, S. F. (2004). The distribution of fitness effects caused by single-nucleotide substitutions in an RNA virus. Proceedings of the National Academy of Sciences101(22), 8396-8401.

Silander, O. K., Tenaillon, O., & Chao, L. (2007). Understanding the evolutionary fate of finite populations: the dynamics of mutational effects. PLoS biology5(4), e94.

Hybrid Honeyeaters in eastern and western Australia

Gene flow between two non-sister species and perhaps the first record of a particular Honeyeater hybrid.

A few years ago, my sister and her boyfriend travelled around Australia for a year. Occasionally they would send me a picture of the local avifauna. To my knowledge, none of these pictures featured a hybrid. Not that surprising, because hybridization is quite rare on an individual level. There are, however, several Australian species that interbreed, such as parrots and orioles. And the list of Australian hybrids keeps growing: two recent studies report hybrids in the Meliphagidae family (Honeyeaters).

Varied_honeyeater

Varied Honeyeater © Jss367 | Wikimedia Commons


Townsville

The first case was documented in eastern Australia. In the 1970s, Julian Ford already noted that there might be a hybrid zone between Varied Honeyeater (Gavicalis versicolor) and Mangrove Honeyeater (G. fasciogularis) around the city of Townsville. Interestingly, these species are not each others closest relatives. Instead, the Mangrove Honeyeater is more closely related to the Singing Honeyeater (G. virescens).

A paper, published in the Biological Journal of the Linnean Society, examined this hybrid zone with genetic data. Leo Joseph and his colleagues compared the DNA of birds within and outside the hybrid zone. They found that both species are clearly distinct, but that some Mangrove Honeyeaters from Townsville contained a bit of Varied Honeyeater DNA (see figure below). This result suggests that there is a some gene flow from Varied into Mangrove Honeyeater.

Another notable finding concerns the genetic markers on the sex-chromosomes (the Z-chromosome to be precise). These markers showed no signs of introgression, indicating that the sex-chromosomes might play an important role in reproductive isolation. You can check out this excellent review by Darren Irwin on this topic.

admixture_honeyeaters.jpg

The genetic structure of Varied Honeyeater (blue) and Mangrove Honeyeater (red) in eastern Australia. (A) For the autosomal markers (i.e. non-sex chromosomes), some Mangrove Honeyeaters contain a bit of Varied Honeyeater DNA. (B) The species are clearly distinct for markers on the sex-chromosomes.


Kensington

For the second hybrid case, we need to travel to western Australia. In Kensington, Geoffrey Groom observed a peculiar Honeyeater that might be a hybrid between New-Holland Honeyeater (Phylidonyris novaehollandiae) and White-cheeked Honeyeater (P. niger). In the journal Australian Field Ornithology, he described several features that support this conclusion.

The bird has characteristics of both species. For example, a dark iris is typical for adult White-cheeked Honeyeaters whereas the black and white throat is only seen in New-Holland Honeyeater. However, a genetic study is needed to confirm the hybrid origin of this bird.

hybrid and parents.jpg

The putative hybrid (middle) between the suggested parental species: White-cheeked Honeyeater (top) and New-Holland Honeyeater (bottom). © Geoffrey Groom


References

Groom, G. N. (2019). A photographic record of a possible New Holland Honeyeater Phylidonyris novaehollandiae longirostris × White-cheeked Honeyeater P. niger gouldii hybrid. Australian Field Ornithology36.

Irwin, D. E. (2018). Sex chromosomes and speciation in birds and other ZW systems. Molecular ecology27(19):3831-3851.

Joseph, L., Drew, A., Mason, I. J., & Peters, J. L. (2019). Introgression between non-sister species of honeyeaters (Aves: Meliphagidae) several million years after speciation. Biological Journal of the Linnean Society128(3):583-591.


The papers have been added to the Meliphagidae page. A big thanks to Leo Joseph for sending me this paper and to Geoffrey Groom for citing my work.

Sparrows illustrate the possible outcomes of hybridization: from a hybrid species to a mosaic hybrid zone

“It’s Difficult to Make Predictions, Especially About the Future”

– Niels Bohr (possibly)

Predicting the outcome of hybridization is challenging, partly because there are numerous outcomes. First, when two species hybridize, they could merge into one species. This phenomenon – known as species collapse – might be occurring with tree finches (genus Camarhynchus) on Floreana Island, Galápagos Archipelago. Alternatively, the hybridizing species might form a hybrid zone, which could (1) remain stable for long periods of time, (2) shift due to changes in local conditions or (3) dissolve as the interacting species evolve complete reproductive isolation (through reinforcement). Finally, hybridization can give rise to a new species by means of hybrid speciation. Several hybrid bird species have been proposed and I have recently reviewed the evidence for these cases. To recap, here are some possible outcomes of hybridization:

  • Species collapse
  • Stable hybrid zone
  • Completion of reproductive isolation
  • Hybrid speciation

A study in the journal Ecology and Evolution found evidence for three of these outcomes within one study system. An evolutionary goldmine!

600px-Male_House_Sparrow_open_beak.jpg

A singing House Sparrow in Brussels © Luc Viatour | Wikimedia Commons


Hybrid Species

The study system I am referring to concerns hybridization between House Sparrow (Passer domesticus) and Spanish Sparrow (P. hispaniolensis). In Italy, they gave rise to one of the most iconic hybrid species: the Italian Sparrow (P. italiae). Here is a quick summary from my review paper:

Captive‐bred hybrids between house sparrow (Passer domesticus) and Spanish sparrow (P. hispaniolensis) so resemble the Italian sparrow (P. italiae) that it was hypothesized to be of hybrid origin. The Italian Sparrow shares mitochondrial haplotypes with both parental species and genetic analyses of both microsatellite data and nuclear sequences already indicated an admixed nuclear genome. These results were later confirmed by genomic data. The hybrid speciation event probably occurred less than 10,000 years ago when house sparrows expanded across Europe and came into contact with the Spanish sparrow. The Italian Sparrow appears to be reproductively isolated from the Spanish sparrow, because no signs of interbreeding were detected in a sympatric area on the Gargano Peninsula in Italy. In contrast, the Italian sparrow does interbreed with the house sparrow in the Alps, but mito‐nuclear and sex‐linked incompatibilities probably result in partial reproductive isolation between these species.

That is one possible outcome of hybridization confirmed: hybrid speciation. You can read more about this case in two other blog posts (see here and here).

italian_sparrow.jpg

An Italian Sparrow in Riva San Vitale, Svizzera. © Omar Bariffi | Flickr


Reproductive Isolation

The researchers also sampled birds from the Iberian Peninsula (Spain and Portugal) where the House Sparrow and Spanish Sparrow live side by side. Genetic analyses uncovered weak signs of gene flow between the species. Despite some gene flow, there were no obvious hybrids in the area. Hence, the authors concluded that “the near absence of phenotypic hybrids in the Eurasian area of sympatry rather suggests that despite limited interspecific gene flow, species integrity of these two is maintained due to genomic parental incompatibilities.” These results indicate that reproductive isolation is nearly complete between Iberian House Sparrows and Spanish Sparrows. Second possible outcome confirmed: (nearly) complete reproductive isolation.

Cotek_Ebûr

A couple of Spanish Sparrow © Dûrzan | Wikimedia Commons


Hybrid Zone

For the third outcome of hybridization, we need to cross the straight of Gibraltar. Here, in northern Africa, House Sparrows and Spanish Sparrows are also living side by side. In contrast to the Iberian situation, they are hybridizing extensively. The genetic analyses indicated high levels of gene flow between the two species. This situation is likely due to increasing urbanization and intensive agriculture in the late 19th century. These developments created patches of urban areas where House Sparrows and Spanish Sparrows meet and interbreed, resulting in a mosaic hybrid zone. And that is a third outcome confirmed: a stable (?) hybrid zone.


References

Ottenburghs, J. (2018). Exploring the hybrid speciation continuum in birds. Ecology and Evolution, 8(24), 13027-13034.

Päckert, M., Ait Belkacem, A., Wolfgramm, H., Gast, O., Canal, D., Giacalone, G., Lo Valvo, M., Vamberger, M., Wink, M., Martens, J. & Stuckas, H. (2019). Genetic admixture despite ecological segregation in a North African sparrow hybrid zone (Aves, Passeriformes, Passer domesticus × Passer hispaniolensis). Ecology and Evolution.


This paper has been added to the Passeridae page. And a big thanks to Martin Päckert for sending me this study.

D-statistics for Dummies: A simple test for introgression

A three-sample test to detect introgression.

Introgressive hybridization seems to be a common phenomenon. The advent of genomic data has revealed the exchange of genetic material between numerous species (see for example Mallet et al. (2016) and Taylor & Larson (2019) for recent reviews). In concert with the explosive expansion in genomic resources, scientists have developed several statistical tests to detect introgression. I have provided an overview of these methods in my Avian Research paper: “Avian Introgression in the Genomic Era”. However, new methods keep popping up and a recent addition to the introgression-toolbox is particularly interesting: in the journal Molecular Biology and Evolution, Matthew Hahn and Mark Hibbins introduce a three-sample test for introgression.


ABBA-BABA

To understand the rationale behind this test – which has been dubbed D3 – we first have to delve into the D-statistic, also known as the ABBA-BABA-test. This approach was developed to quantify the amount of genetic exchange between Neanderthals and modern humans. The rationale behind this test is quite straightforward: it considers ancestral (‘A’) and derived (‘B’) alleles across the genomes of four taxa. Under the scenario without introgression, two particular allelic patterns ‘ABBA’ and ‘BABA’ should occur equally frequent. An excess of either ABBA or BABA, resulting in a D-statistic that is significantly different from zero, is indicative of gene flow between two taxa. A positive D-statistic (i.e. an excess of ABBA) points to introgression between P2 and P3, whereas a negative D-statistic (i.e. an excess of BABA) points to introgression between P1 and P3.

A Z-score can be calculated to assess the significance of the D-statistic. I will not explain the mathematical underpinnings of the Z-score. All you need to know, is that a Z-score bigger than 3 or smaller than -3 can be interpreted as a significant result. Interested readers can check Durand et al. (2011) for more information.

The figure below illustrates the D-statistic with an example from my own work (see Ottenburghs et al. (2017) for more details). Comparing the genomes of four goose species reveals that Cackling Goose (Branta hutchinsii) and Canada Goose (B. canadensis) share more derived alleles than expected by chance. The resulting positive D-statistic suggests introgression between these species, which is not that surprising because there is a hybrid zone between these geese.

example_Dstat.jpg

The positive D-statistic indicates an excess of ABBA-patterns in the genomes of these geese, suggesting introgression between Cackling Goose (Branta hutchinsii) and Canada Goose (B. canadensis). Based on Ottenburghs et al. (2017) BMC Evolutionary Biology


Three-sample Test

One limitation of the D-statistic is that you need an outgroup to discriminate between ancestral and derived alleles. The method by Hahn and Hibbins circumvents this issue by focusing on branch lengths instead. Let’s see how this works. Consider a tree with three species: A, B and C. The correct arrangement of these species is shown below: A is more closely related to B than to C. In this case, there are two discordant arrangements: AC and BC. When there is no introgression, these discordance patterns should occur in equal frequencies. With introgression, however, we can expect other patterns. The authors explain that “introgression between B and C leads to both more trees with a BC topology and a shorter pairwise distance between these two lineages. As a result, dB–C [i.e. genetic distance between B and C] will be smaller than dA–C [i.e. genetic distance between A and C], leading to a negative value of D3. Conversely, gene flow between A and C leads to positive values of D3.”

figure_trees.jpg

Two discordance arrangements (BC and AC) are expected in equal frequencies when there is no gene flow. With introgression, one pattern becomes more common and results in a decreased genetic distance between some species. From: Hahn & Hibbins (2019) Molecular Biology and Evolution


Putting it into Practice

From this line of thinking, the researchers deduced a formula (see below) that is solely based on the genetic distances between the species and does not require an outgroup. I applied this new statistic to my goose data. I searched through my PhD-archive and found a table of genetic distances between the different goose species. Putting these numbers into the formula resulted in a D3 of -0.01 This outcome suggests gene flow between B and C, which corresponds to Cackling Goose and Canada Goose. This is in line with my findings based on the D-statistic (luckily…). Unfortunately, I could not test the significance of this result.

D3.jpg


Some Cautionary Notes

This new statistic seems promising for studies that could not sample an appropriate outgroup. However, one should not take this method at face value. A significant D3-statistic does not automatically mean that there has been introgression. Other evolutionary processes can influence this statistic (similar to the classic D-statistic). For example, population structure in the ancestor can produce deviations in the number of discordance topologies. Or introgression might come from unsampled or extinct species. Therefore, it is important to complement these statistics with other analyses to quantify introgression.


References

Durand, E. Y., Patterson, N., Reich, D., & Slatkin, M. (2011). Testing for ancient admixture between closely related populations. Molecular Biology and Evolution, 28(8), 2239-2252.

Hahn, M. W., & Hibbins, M. S. (2019). A three-sample test for introgression. Molecular Biology and Evolution.

Leafloor, J. O., Moore, J. A., & Scribner, K. T. (2013). A hybrid zone between Canada Geese (Branta canadensis) and Cackling Geese (B. hutchinsii). The Auk, 130(3), 487-500.

Mallet, J., Besansky, N., & Hahn, M. W. (2016). How reticulated are species? BioEssays, 38(2), 140-149.

Ottenburghs, J., Megens, H. J., Kraus, R. H., Van Hooft, P., van Wieren, S. E., Crooijmans, R. P., Ydenberg, R.C., Groenen, M.A.M. & Prins, H. H. T. (2017). A history of hybrids? Genomic patterns of introgression in the True Geese. BMC Evolutionary Biology, 17(1), 201.

Ottenburghs, J., Kraus, R. H., van Hooft, P., van Wieren, S. E., Ydenberg, R. C., & Prins, H. H. (2017). Avian introgression in the genomic era. Avian Research, 8(1), 30.

Taylor, S. A., & Larson, E. L. (2019). Insights from genomes into the evolutionary importance and prevalence of hybridization in nature. Nature Ecology & Evolution, 3(2), 170-177.

The evolution of feathers: How sexual selection set the stage for natural selection

Sexual selection might create bridges across the adaptive landscape.

Evolution is sometimes depicted as a journey across a hilly landscape: valleys correspond to low fitness areas while hills represent adaptive optima. Natural selection will push populations uphill, culminating in beautifully adapted phenotypes. But what happens when a population reaches such an adaptive peak? Natural selection won’t allow a slow descent, so the population is effectively stuck on the peak even though there might be other (perhaps better) adaptive peaks nearby. In a recent Evolution paper, Scott Persons and Philip Currie provide a possible solution for this conundrum: sexually selected bridges. They illustrate this concept with the evolution of feathers.

Ajancingenia_reconstruction.png

A male Ajancingenia yanshini with a tail-feather fan displaying to female. © Sydney Mohr | Wikimedia Commons


A Journey Across the Adaptive Landscape

The fossil record of non-avian Dinosaurs contains several examples of early feathers: simple filaments or plumaceous structures (Stages 1 and 2 in the figure below). The consensus among paleontologists is that these “feathers” primarily functioned as insulators. In terms of the adaptive landscape, early feather-like structures allowed these Dinosaurs to climb the adaptive peak of insulation.

feathers

The different stages of feather evolution © Emily A. Willoughby | https://emilywilloughby.com

Later on, more complex arrangements of feathers evolved, such as the tail fans of oviraptosaurs. One can easily see how such elaborate feathers could function in sexual displays, similar to modern birds. Hence, these more complex feathers could be influenced by sexual selection. These feathers might have been a nuisance in terms of survival: think of the difficulties long-tailed peacocks encounter when trying to escape from predators. Hence, the complex feathers provide low fitness in the perspective of natural selection, but high fitness in a sexual selection context. However, the sexual selection hypothesis is still quite speculative. The authors state that “paleontology still awaits the single most conclusive piece of affirmative evidence: the recognition of sexual dimorphism in dinosaur feather morphology.”

If we return to the adaptive landscape metaphor, the Dinosaurs transversed a valley with the aid of sexual selection. The journey across this valley eventually brought the Dinosaurs at the base of an unexplored adaptive peak: the hill of aerial locomotion. Here, natural selection started pushing the populations uphill, resulting in the feathered and flying birds we know today.

evo13795-fig-0004-m.jpg

The hypothesized journey across the adaptive landscape of feather evolution. Sexual selection provided a bridge between isolation (left peak) and aerial locomotion (right peak). From: Persons & Currie (2019) Evolution


A Hybrid Bridge

This study provides a nice example of how sexual selection can provide the raw material for natural selection to work with. Given that this website mainly concerns hybridization in birds, you might be wondering what this blog post has to do with avian hybrids. Honestly, nothing. I just found this Evolution paper so cool that I decided to write about it.

Although… Hybridization could provide another way to bridge two adaptive peaks. The exchange of genetic material between species might allow populations to explore different areas of the adaptive landscape. I have covered these ideas in previous blog posts on combinatorial speciation and hybridization as the engine of adaptive radiations.


References

Persons, W. S., & Currie, P. J. (2019). Feather evolution exemplifies sexually selected bridges across the adaptive landscape. Evolution, 73(9):1686-1694.

A big thanks to Emily A. Willoughby for permission to use the feather artwork. Be sure to check out her website (https://emilywilloughby.com) for more amazing artwork.