Does migratory behavior affect genetic diversity in the Golden-crowned Kinglet?

A recent study compared the genetic make-up of migratory and resident populations across North America.

In January 2016 I attended the Plant and Animal Genomics (PAG) meeting in San Diego. Obviously, I took some time off for bird watching and managed to add some new species to my life-list, including the Ruby-crowned Kinglet (Regulus calendula). However, this blog post will not focus on this red-capped beauty, but on a related species: the Golden-crowned Kinglet (R. satrapa). This small songbirds has a wide distribution across North America and displays an interesting behavior: populations in the center of the range migrate while the peripheral populations (on the east and west coast) are resident.

This situation provides ideal circumstances to study the effect of migratory behavior on genetic differentiation and diversity. Resident behavior is expected to reduce gene flow between populations, resulting in more genetic differentiation. In addition, the reduction in gene flow might increase the influence of genetic drift in isolated populations, which leads to loss of genetic diversity. Migratory behavior, on the other hand, will increase levels of gene flow, culminating in less genetic differentiation and more genetic diversity. A recent study in the Journal of Ornithology tested these predictions.

golden-crowned_kinglet

A Golden-crowned Kinglet in Washington © Francesco Veronesi | Wikimedia Commons


East and West

The researchers used seven microsatellites to probe the genetic make-up of migratory and resident populations of Golden-crowned Kinglets across North America. These genetic markers revealed a clear separation between eastern and western populations (in accordance with a previous study). This geographical pattern is probably a genetic signature of the Last Glacial Maximum when eastern and western populations of Golden-crowned Kinglets were isolated in distinct refugia. The population in Alberta showed some signs of admixture and could be a potential bridge for gene flow between east and west.

But what about migratory and resident populations? The authors start their discussion with the following statement: “We found no evidence to support our hypothesis that migratory behaviour influences neutral genetic differentiation and neutral genetic diversity for Golden-crowned Kinglets.” Indeed, there was no significant difference in genetic differentiation or diversity between migratory and resident populations.

Fst

There was no significant difference in genetic differentiation between migratory and resident populations of the Golden-crowned Kinglet. From: Graham et al. (2020) Journal of Ornithology


Genomics

It thus seems that the genetic population structure of these passerines is mainly determined by the glacial dynamics of the Pleistocene. Does this mean that migratory behavior has no effect on genetic patterns? Not necessarily, there are several explanations for this result. First, the resident and migratory behaviors might be a recent development that has not yet impacted the genetic make-up of these populations. Second, the genetic markers in this study (seven microsatellites) might be too variable to pick up subtle differences between resident and migratory populations. Moreover, the genetic variants associated with migratory behavior might be restricted to particular genomic regions, such as in warblers (see here and here). A genomic approach is warranted.


References

Graham, B. A., Carpenter, A. M., Friesen, V. L., & Burg, T. M. (2020). A comparison of neutral genetic differentiation and genetic diversity among migratory and resident populations of Golden-crowned-Kinglets (Regulus satrapa). Journal of Ornithology, 1-11.

Phylogenetics in the genomic era: Reconstructing the evolutionary tree of rails (family Rallidae)

A phylogenomic study reports some interesting new relationships.

The life of a “phylogeneticist” used to be so simple. You sequence a couple of genes, align them with your favorite software (mostly Clustal), and run some phylogenetic analyses (maximum likelihood, maximum parsimony and perhaps something Bayesian). Then genomic data arrived. Suddenly, there were thousands of genes and non-coding elements to take into account. What was worse, different genes often resulted in different gene trees! The life of the phylogeneticist – or should I say phylogenomicist – just became a whole lot more complicated and more exciting.

Obviously, I exaggerated here. Phylogenetics was never that simple. But the advent of genomic data did open up many avenues for further research. These new opportunities came with an expansive toolkit of software and analysis methods. You can check out the details in this recent paper in Nature Reviews Genetics: Phylogenetic tree building in the genomic age.  In this blog post, however, I would like to focus on two general methods to construct phylogenetic trees from genomic data, namely concatenation and coalescent-based consensus approaches.


Supermatrix or Supertree?

To explain both methods, I will borrow some text from a paper I published some years ago in Molecular Phylogenetics and Evolution.

In concatenation (or supermatrix) methods all sampled genes are concatenated and analysed as a single ‘‘supergene”. Supertree methods, on the other hand, involve separate analyses of the sampled genes and subsequent integration of the resulting trees into a species tree. Certain supertree methods incorporate the multispecies coalescent model to estimate the species tree from a set of heterogeneous gene trees.

In short, during a concatenation analysis you paste all the genes together and analyse them as if they are one big gene. In supertree methods, you generate a gene tree for each gene and then combine them into a species tree. Simple.

supermatrix_tree

The difference between supermatrix and supertree methods. From: Delsuc et al. (2003) Nature Reviews Genetics


A tree of rails

A recent study in the journal Diversity applied both methods to reconstruct the evolutionary history of the rail family. The researchers analyzed 393 loci from 63 species. In the abstract, they report that “Concatenated maximum likelihood and coalescent species-tree approaches recover identical topologies with strong node support.” That is good news and suggests that the phylogeny has been resolved reliably. There are several intriguing findings, so let’s have a look at a few unexpected results.

First, a bombshell: the family Rallidae (as we know it) is not monophyletic. The Forbes’ Forest rail (Rallicula forbesi) does not cluster with the other rails, but is more closely related to the flufftail (Sarothrura rufa). Together, these species are best classified in a distinct family: the Sarothruridae. Another new insight concerns the African Nkulengu rail (Himantornis haematopus). This species now occupies its own separate branch (which is in agreement with morphological data)

rail_tree

The phylogenetic relationships between different rail species. Notice the location of Rallicula forbesi outside the core family. Colors correspond to different genera. From: Garcia-R et al. (2020) Diversity


Unstable genera

The analyses revealed some other interesting relationships that rendered several genera non-monophyletic.

  • The African crake (Crex egregia) is more closely related to Rouget’s rail (Rougetius rougetii) than to its congeneric, the corn crake (C. crex).
  • The positions of the New Guinea flightless rail (Megacrex inepta) and the watercock (Gallicrex cinerea) break the monophyly of the genus Amaurornis.
  • The Inaccessible rail (Atlantisia rogersi) falls within the genus Laterallus.

Clearly, there is some taxonomic work ahead of us.

crex_egregia

Two African crakes © Derek Keats | Flickr


Stems and crown groups

Finally, the researchers also attempted to date the resulting phylogenetic tree. When did all these species arise? The answer to that question strongly depends on the placement of the Belgirallus fossil. This taxon represents the oldest known fossil of the Rallidae, but the exact relationship with extant species is unknown: it can be considered as a representative of the stem or the crown group. What is the difference, you ask? Well, a crown group is the smallest clade that includes all living members of a group and any fossils nested within it. A stem group is a set of extinct taxa that are not in the crown group but are more closely related to the crown group than to any other.

If you consider Belgirallus as part of the stem group, the Rallidae originated around 26 million years ago. But if you place it within the crown group, the origin of Rallidae shifts to about 33 million years ago. More fossils are needed to resolve this issue.

Fig.3.8

The difference between crown and stem groups. From: Noriyuki Satoh (2016) Chordate Origins and Evolution


References

Garcia-R, J. C., Lemmon, E. M., Lemmon, A. R., & French, N. (2020). Phylogenomic Reconstruction Sheds Light on New Relationships and Timescale of Rails (Aves: Rallidae) Evolution. Diversity12(2), 70.

Kapli, P., Yang, Z., & Telford, M. J. (2020). Phylogenetic tree building in the genomic age. Nature Reviews Genetics, 1-17.

Hybridizing hyenas and how to find them

Genomes of extant and extinct hyenas reveal a reticulated history.

Almost every study that uses genomic data to retrace the evolutionary history of particular species uncovers traces of hybridization. Hyenas are no exception. A recent paper in the journal Science Advances reported gene flow between African spotted hyenas and extinct Eurasian cave hyenas. Spotted hyenas (Crocuta crocuta) are large carnivores that currently occur in sub-Saharan Africa. Compared to their African cousins, cave hyenas have shorter limbs and blunter teeth, suggesting that they were mainly scavengers. Based on more suble morphological differences, cave hyenas have been split into European (spelaea) and Asian (ultima) subspecies.

The genomic data pointed to a deep divergence (about 2.5 million years ago) followed by bidirectional gene flow sometime before 475,000 years ago. The study nicely outlines the different analyses that led to this conclusion. Let’s have a look.

spotted-hyena-3474798_960_720

A Spotted Hyena © Alicave | Pixabay


Phylogenetics

We start with the mtDNA. Previous work with short mitocondrial fragments could not differentiate between spotted and cave hyenas. Using whole mitochondrial genomes did not markedly change this conclusion. The resulting evolutionary tree is a mixture of both hyenas, albeit with more resolution.

Perhaps nuclear DNA might help resolve this phylogenetic mess? The researchers constructed almost 500 phylogenetic trees based on DNA sequences of 2 million letters. Most of these trees supported a clear split between spotted hyenas and cave hyenas. The incongruence between nuclear and mitochondrial phylogenies already indicates that something interesting is happening here. Are we dealing with incomplete lineage sorting or hybridization?

Hyena

Incongruence between mitochondrial and nuclear DNA. (A) Phylogenetic analyses of mtDNA could be discriminate between spotted hyena (blue) and cave hyena (red). (B) Nuclear DNA, however, pointed to a clear split between both hyena types (Africa vs. Europe and Asia). Adapted from: Westbury et al. 2020 Science Advances


D-statistics and Simulations

Next, the researchers turned to everyone’s favorite test for ancient gene flow: the D-statistic (see this blog post for more information). They used an adjusted version of the D-statistic that infers the direction of gene flow. Calculating this statistic for different genomic regions revealed several instances of gene flow between spotted hyenas and cave hyenas. However, the patterns of gene flow depended on the individual genomes that were being compared. These results can be explained in two ways: (1) multiple gene flow events into spotted hyenas or (2) a single admixture event was followed sorting of the cave hyena loci.

To figure out which explanation was more likely, another approach was added to the mix: a coalescent modelling excercise. The researchers used Fastsimcoal to explore different scenarios of gene flow. These analyses suggested that gene flow was mostly bidirectional but with more gene flow from Europe into Africa in more recent times (as shown in the figure below). Given that the spotted and cave hyenas with mitochondrial haplotype A diverged about 475,000 years ago, these gene flow events probably happened after this split. More research is needed to pinpoint the exact timing.

hyena_tree

The most likely model of gene flow between spotted hyenas and cave hyenas. From: Westbury et al. 2020 Science Advances


Summary

The researchers nicely summarize their findings: “We suggest a bidirectional gene flow event between cave and spotted hyenas after the split of cave hyenas into the European and Asian lineages and a subsequent unidirectional gene flow event into northern spotted hyenas, followed by differential diffusion of the admixed loci within the other spotted hyena lineages”


References

Westbury, M.V. et al. (2020). Hyena paleogenomes reveal a complex evolutionary history of cross-continental gene flow between spotted and cave hyena. Science Advances6(11), eaay0456.

Conservation genetics in China: Comparing genetic diversity of Siberian and Sichuan Jays

Is the low population size of the Sichuan Jay reflected in their genetic make-up?

Somewhere in the mountains of western China you might stumble upon a peculiar species: the Sichuan Jay (Perisoreus internigrans). Little is known about this corvid. A survey between 1999 and 2004 estimated about 1 individual per km2 in Jiuzhaigou (and the density was even lower in Zhuoni). These low densities are probably the result of habitat fragmentation: large patches of pristine forest have been removed. Moreover, the habitat of the Sichuan Jay has been influenced by the Pleistocene ice ages when forests were fragmented by advancing ice sheets. Taken together, we can expect that these events led to a significant reduction in population size and hence genetic diversity. A recent study in the journal Conservation Genetics put this expectation to the test.

Perisoreus internigrans

A Sichuan Jay in China © Tang Jun | Oriental Bird Images

Genetic Diversity

Kai Song and his colleagues collected samples from 58 Sichuan Jays and compared their DNA with 205 Siberian Jays (P. infaustus) from Sweden and Russia. As explained above, the researchers expected a clear reduction in genetic diversity in the Sichuan Jays. Suprisingly, this was not the case. Both species showed similar levels of genetic diversity, despite the more restricted range of the Sichuan Jay.

Moreover, the populations of Sichuan Jay showed clear population structure, separating into three clear clusters (see figure below). Unfortunately, the sampling locations of these birds have been lost, so it is currently not possible to relate this structure to particular geographical locations.

plot

The genetic analyses revealed clear population structure in the Sichuan Jay. From: Song et al. (2020) Conservation Genetics

Conservation

Does the high level of genetic diversity mean that we should not worry about the Sichuan Jay which is currently considered “vulnerable” by the IUCN? Not necessarily, the analyses were based on microsatellites, which are known to be very variable. It is thus possible that this study overestimated the amount of genetic diversity. In addition, the clear separation into three clusters suggests that the populations of Sichuan Jays are highly fragmented into small populations. This might make them more vulnerable to environmental changes.

Habitat loss seems to be the most important threat for this Chinese bird species. To prevent further population decline targeted habitat restoration is key. The protection and expansion of virgin conifer forest will not only benefit the Sichuan Jay, but numerous other species, such as Chinese Grouse (Tetrastes sewerzowi) and Sichuan Wood Owl (Strix davidi).

Perisoreus_infaustus

A Siberian Jay in Norway © Bouke ten Cate | Wikimedia Commons

References

Song, K., Halvarsson, P., Fang, Y., Barnaby, J., Germogenov, N., Sun, Y., & Höglund, J. (2020). Genetic differentiation in Sichuan jay (Perisoreus internigrans) and its sibling species Siberian jay (P. infaustus). Conservation Genetics, 21: 319–327.

Figuring out the evolution of forked tails in Swallows and Swifts

A recent study shows that both groups took different evolutionary paths to their deeply forked tails.

A warm summer evening is often accompanied by the acrobatic caprices of swifts and swallows. These agile fliers might look alike but they belong to vastly different bird orders that diverged about 85 million years ago. Swallows are songbirds from the order Passeriformes, while swifts are the closest relatives of hummingbirds in the order Apodiformes. The resemblance between these distantly related groups partly relates to their forked tails. But how did this feature evolve in both groups? A recent study in the Journal of Evolutionary Biology collected data for 72 swallow and 39 swift species to tackle this question.

Apus_apus

 A Common Swift (Apus apus) in Barcelona, Spain. © Pau Artigas | Wikimedia Commons


Selection

To put it bluntly, forked tails can be the outcome of two main evolutionary forces: sexual selection or natural selection. Previous studies have found evidence for both explanations. Male Barn Swallows (Hirundo rustica) with deeply forked tails are more successful with female birds, leading to higher reproductive output. This clearly fits the description of a sexually selected trait. However, other researchers have suggested that natural selection could have shaped these tails to ensure more efficient foraging.

In their study, Hasegawa and Arai put forward several predictions to disentangle the effects of sexual and natural selection. Sexual selection predicts that the fork in the tail will look deeper (i.e. the tail feathers look longer). This can be achieved by longer tail feathers (obviously) or by a shorter central tail feather (less obviously). However, a shortening of this central feather could impair flight in species that rely more on tail lift instead of wing lift. Hence, natural selection would select against a shorter central tail in these species.

Wire_tailed_swallowjpg

A Wire-tailed Swallow (Hirundo smithii) feeding a chick ©Manojiritty | Wikimedia Commons


Convergent Evolution

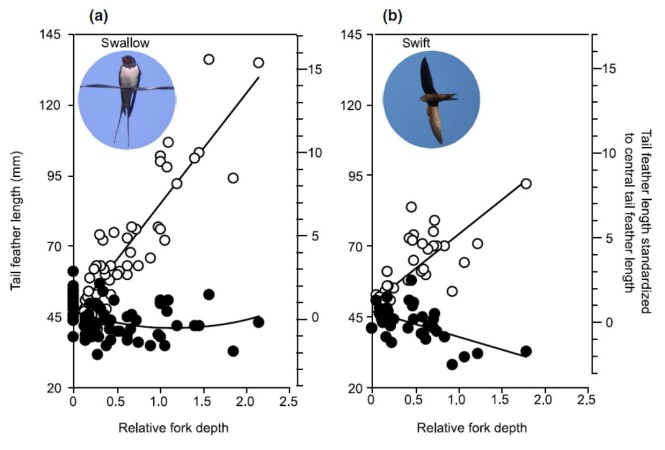
I will not dwell on the technical details – they used a phylogenetic comparative approach – but the results supported a main role for sexual selection in the evolution of forked tails. In both groups, the length of the central tail feather decreased with deeper tails. In swifts, this pattern was linear, while in swallows the relationship was concave (see figure below). This subtle difference is highlighted in the title of the paper: “Fork tails evolved differently in swallows and swifts.”

Moreover, the white spots on some swallow tails gave the impression that the tail is even longer. This optical illusion could relax the sexual selection on the central tail feather. Instead of shortening this feather (and potentially losing aerial maneuverability), swallows just add some white spots to let their tail appear longer. An alluring hypothesis that requires more research.

tail

The central tail feather (black dots) decreased with deeper forks. In swallows, the relationship is concave, whereas in swifts it is linear. From: Hasegawa & Arai (2020) Journal of Evolutionary Biology


Setting the Stage

So, does this study settle the debate: forked tails in swifts and swallows were shaped by sexual selection? You could definitely argue that the recent evolutionary history of this trait was mainly driven by sexual selection. The relationship between tail length and reproductive success is indeed very convincing. However, perhaps these forked tails first evolved in the context of aerial maneuverability and were later co-opted by sexual selection. In other words, natural selection set the stage for sexual selection*.


References

Hasegawa, Masaru, and Emi Arai (2020) Fork tails evolved differently in swallows and swifts. Journal of Evolutionary Biology. Early View.

* This scenario nicely contrasts with the evolution of feathers where sexual selection set the stage of natural selection. You can read more about it in this blog post.