A more technical story on the evolution of genomic landscapes in wood-warblers.
Any birdwatcher can list the morphological characters that he or she uses to discriminate between closely related species. But how is this variation reflected on the genetic level? The possibility to sequence the entire genome of an individual has allowed biologists to explore this question. In general, they scan across the genome looking for differentiated regions (based on a collection of summary statistics). These ‘genomic landscapes’ hold to key to understand how bird species diversify. A recent study in the journal Molecular Ecology applied this approach to several members of the Parulidae family (New World warblers or wood-warblers).
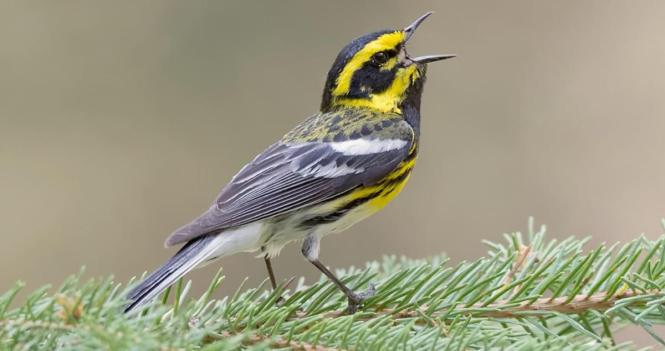
Townsend’s Warbler (from: https://www.allaboutbirds.org/)
Some Summary Statistics
Darren Irwin (University of British Columbia) and his colleagues used three summary statistics: Fst, π(between) and π(within). What do these statistics actually represent?
Fst
The American geneticist Sewall Wright introduced Fst to explore how genetic variation is structured between populations by comparing the genetic variation within and between these populations. Fst ranges from 0 to 1, where zero implies that the two populations are freely interbreeding and where one implies that all genetic variation is explained by the population structure. This statistic can also be used to pinpoint genomic regions that are different between two populations.
π(between)
This statistic is also known as Dxy and indicates the absolute genetic distance between two populations (in contrast to Fst, which is a relative measure). It counts the number of differences between two DNA sequences from distinct populations. For example, the sequences AATTCC and AATTGG differ in two positions. You can calculate π(between) by dividing the number of differences and the total sequence length: 2/6 = 1/3 or 33%.
π(within)
The last summary statistic is similar to π(between) but instead of comparing individuals of two populations, you calculate it between individuals from the same population.
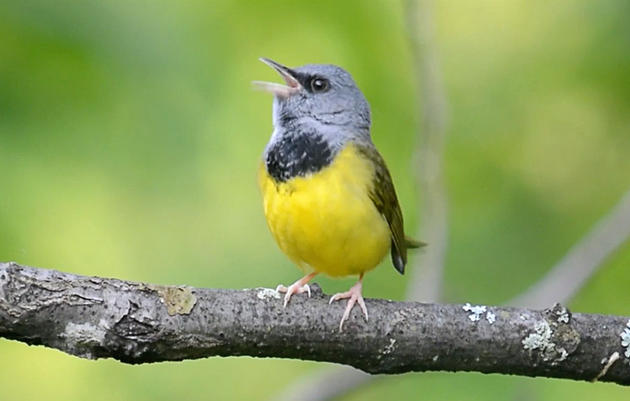
Mourning Warbler (from https://www.allaboutbirds.org/)
Four Models
By studying these three summary statistics, you can infer the evolutionary history of bird populations. For example, if two species diverged with some gene flow, you would expect that genomic regions that contribute to reproductive isolation – and are thus not exchanged between species – become different over time. So, both Fst and π(between) should be higher in these regions.
If, on the other hand, the species diverged without gene flow but were subject to different selection pressures, regions of high Fst are expected to show lower π(within), because selection tends to lower the genetic variation within a population.
Another pattern that is commonly observed in regions of high Fst and low π(between). This can be explained by a ‘recurrent selection’ model where these divergent genomic regions experienced strong selection before the species split, followed by recurrent selection after the split.
The authors of this study introduce a fourth model – ‘geographic-sweep-before-selective-differentiation’ – in which advantageous genetic variants spread through a geographically structured species complex. The outcome would be reduced π(between) and π(within) in regions of high Fst.
I can imagine that the four models and their predictions make your head spin. Luckily, the researchers provided a graphical representation of these models. Take your time to study this figure and see if you understand the expected patterns.
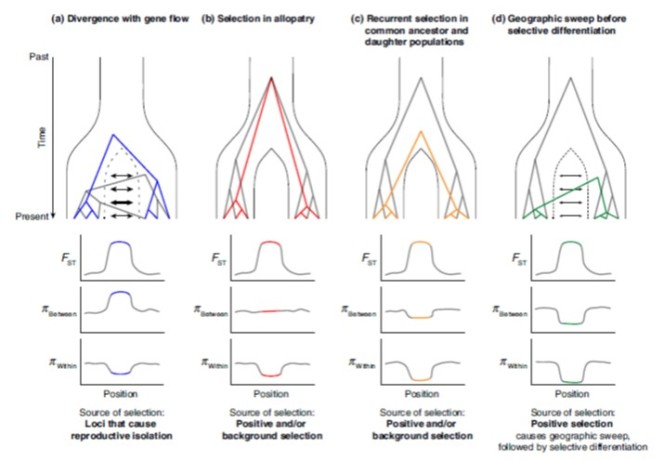
The four models and their predictions (From: Irwin et al. 2018, Molecular Ecology)
Three Species Pairs
The authors calculated the summary statistics for three species pairs in the Parulidae family:
- MacGillivray’s Warbler (Geothlypis tolmiei) and Mourning Warbler (G. philadelphia)
- Townsend’s Warbler (Setophaga townsendi) and Black-throated Green Warbler (S. virens)
- Audubon’s Warbler (S. auduboni) and Myrtle Warbler (S. coronata)
In all three comparisons, the genetic patterns point to a model of recurrent selection or sweep-before-differentiation (models c and d in the figure). A more thorough modelling study will be needed to discriminate between these two models.
Interestingly, most of the genomes show little differentiation, only a small fraction is different. This suggests that reproductive isolation is caused by a few highly divergent regions, a pattern that has been observed in several other bird species, such as Wagtails and Nightingales. Moreover, these highly divergent regions – or ‘islands of differentiation’ – were not shared between the species pairs, indicating that the causes of genomic differentiation are specific to each speciation event.
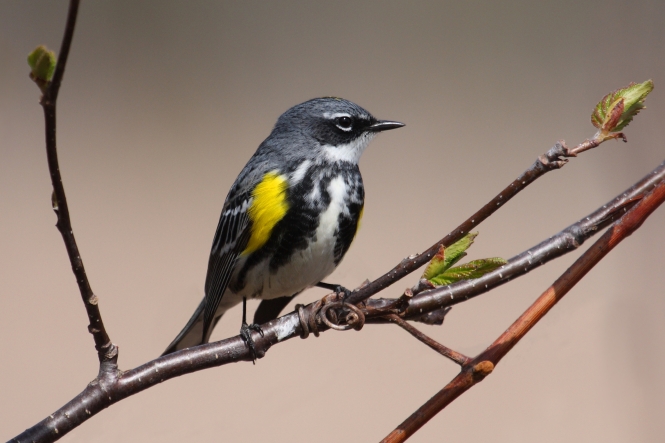
Myrtle Warbler (from http://www.wikipedia.com/)
References
Irwin, D.E., Mila, B., Toews, D.P.L., Brelsford, A., Kenyon, H.L., Porter, A.N., Grossen, C., Delmore, K.E., Alcaide, M. & Irwin, J.H. (2018) A comparison of genomic islands of differentiation across three young avian species pairs. Molecular Ecology.
This paper has been added to the Parulidae page.

You omitted the “Green” of “Black-throated Green Warbler.”
Thanks, I didn’t notice that. It’s corrected now!
[…] other bird species where divergence is concentrated in specific genomic regions (see for example wood-warblers). However, this result could be due to the use of UCEs which only represent a small part of the […]
[…] “islands of differentiation” (I have covered a few of these studies on birds, including wood-warblers, white-eyes and hummingbirds). Two main explanations are currently under debate. One model suggests […]
[…] between these models by looking at three different summary statistics: FST, DXY and π (see this blog post for a detailed explanation). The rationale behind this approach was nicely described in the […]